Lesson: Reading Picture Graphs | Nagwa Lesson: Reading Picture Graphs | Nagwa

Lesson: Reading Picture Graphs Mathematics • First Year of Primary School

In this lesson, we will learn how to read picture graphs, where each picture represents a count of one, to find how many items are in a category and which category has the most or least items.

Lesson Plan

Lesson Video

Video Thumbnail
09:10

Lesson Playlist

  • Countig Picture Graphs to Find Which Category Has the Most or Least Items
    01:53
  • Using Picture Graphs with Three Categories to Tell How Many and How Many More
    02:39
  • Using Picture Graphs with Two Categories to Compare and Count
    01:48

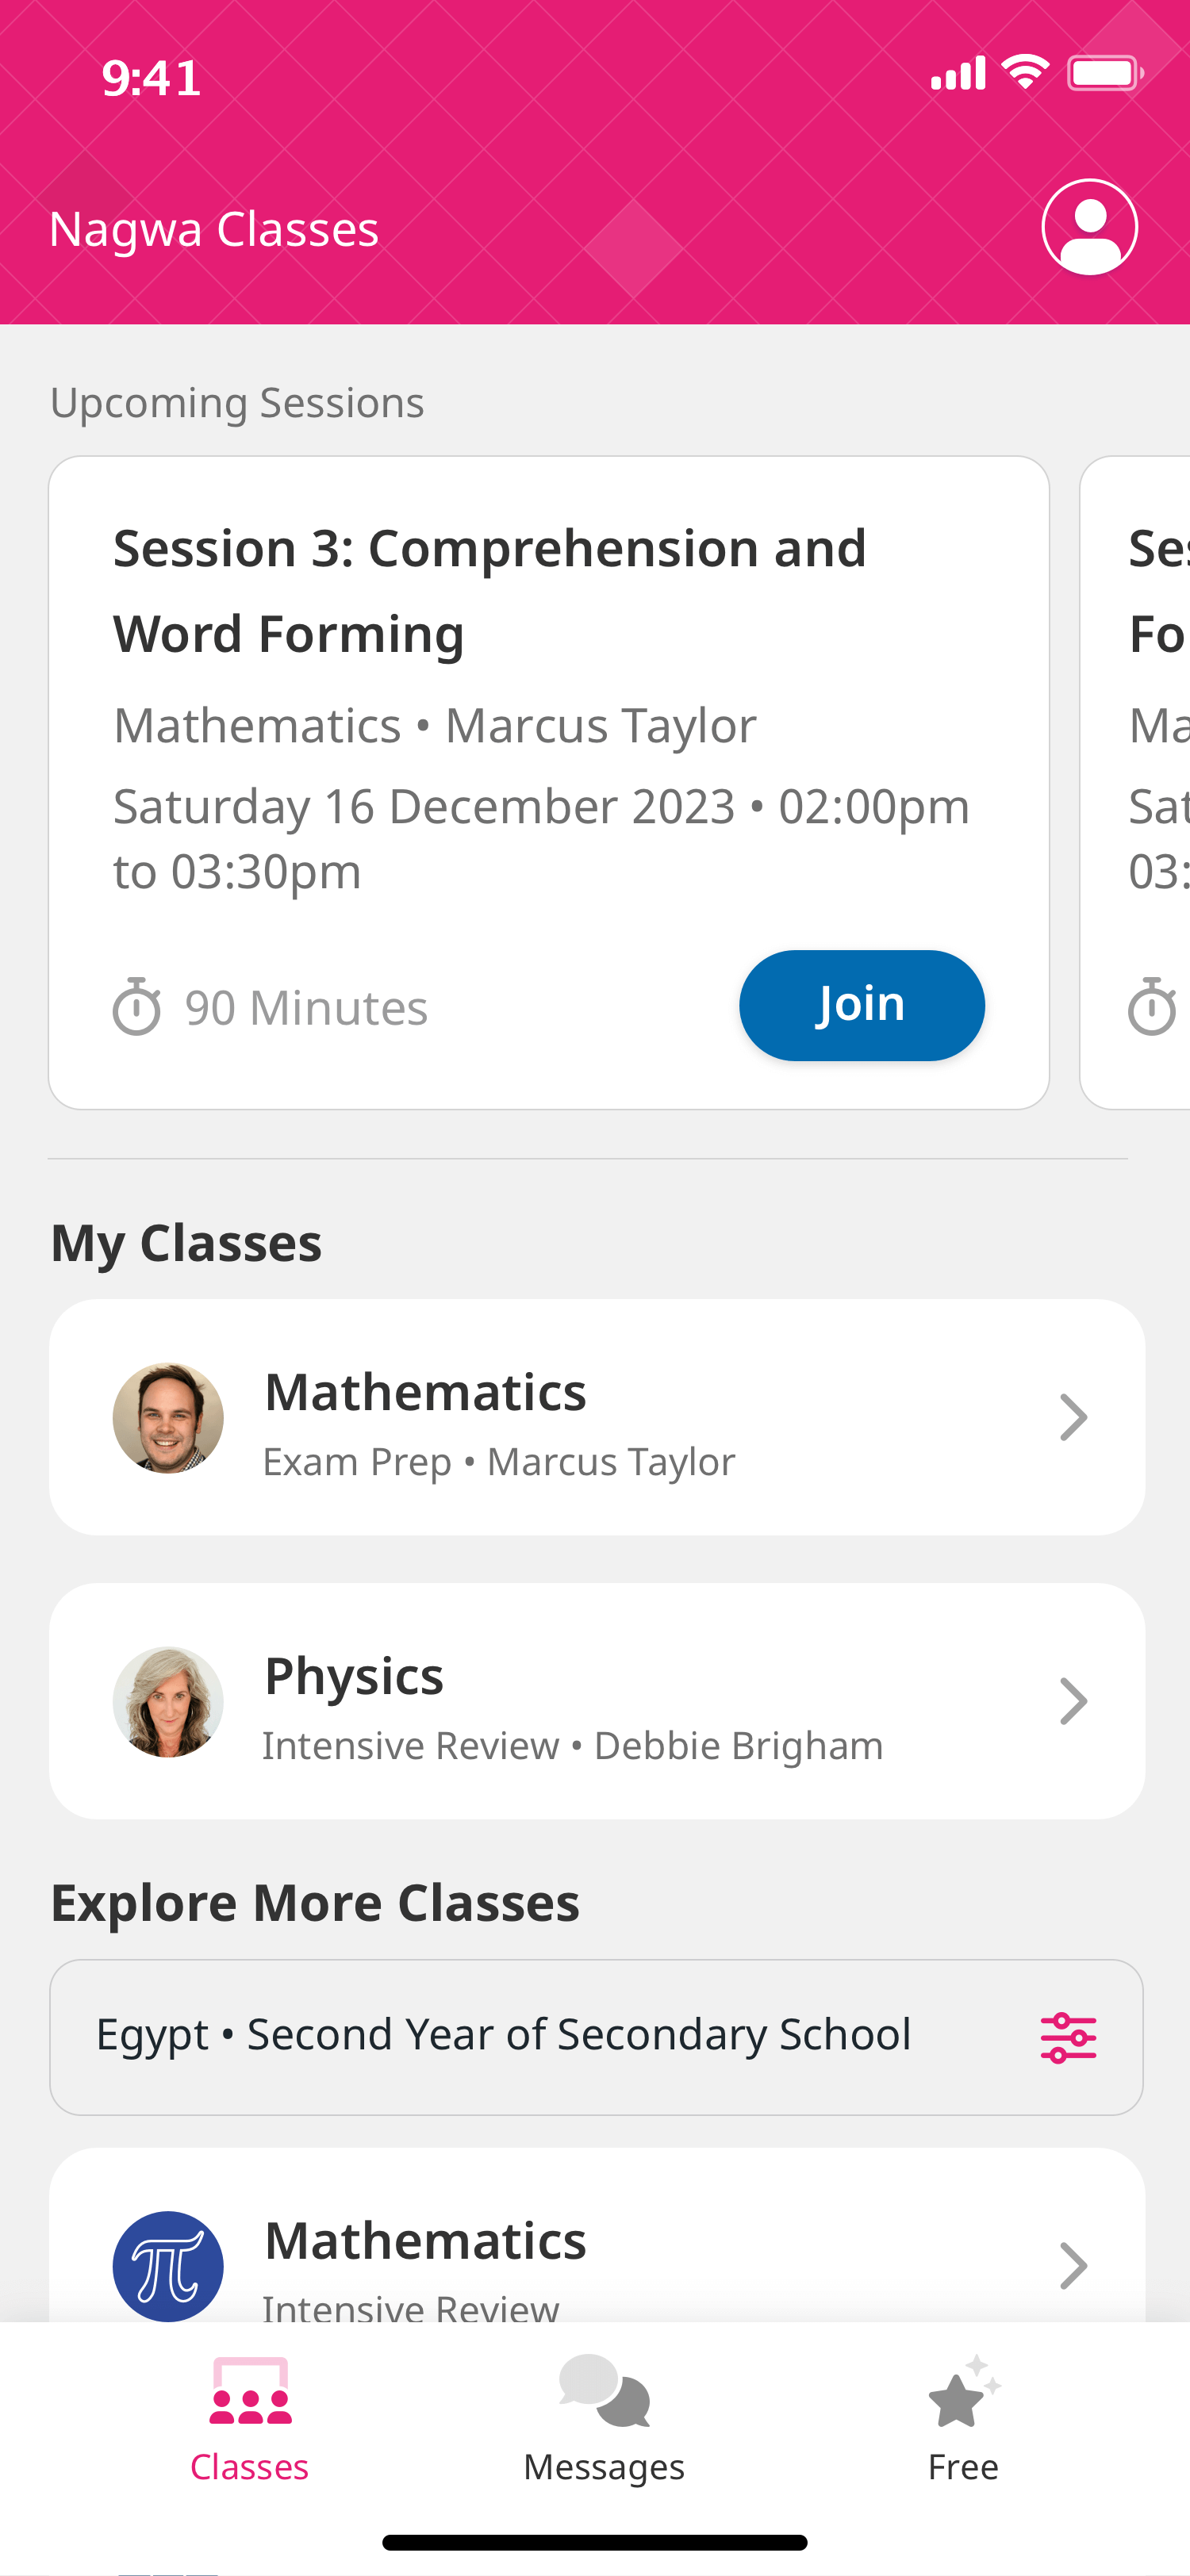
Join Nagwa Classes

Attend live sessions on Nagwa Classes to boost your learning with guidance and advice from an expert teacher!

  • Interactive Sessions
  • Chat & Messaging
  • Realistic Exam Questions

Nagwa uses cookies to ensure you get the best experience on our website. Learn more about our Privacy Policy